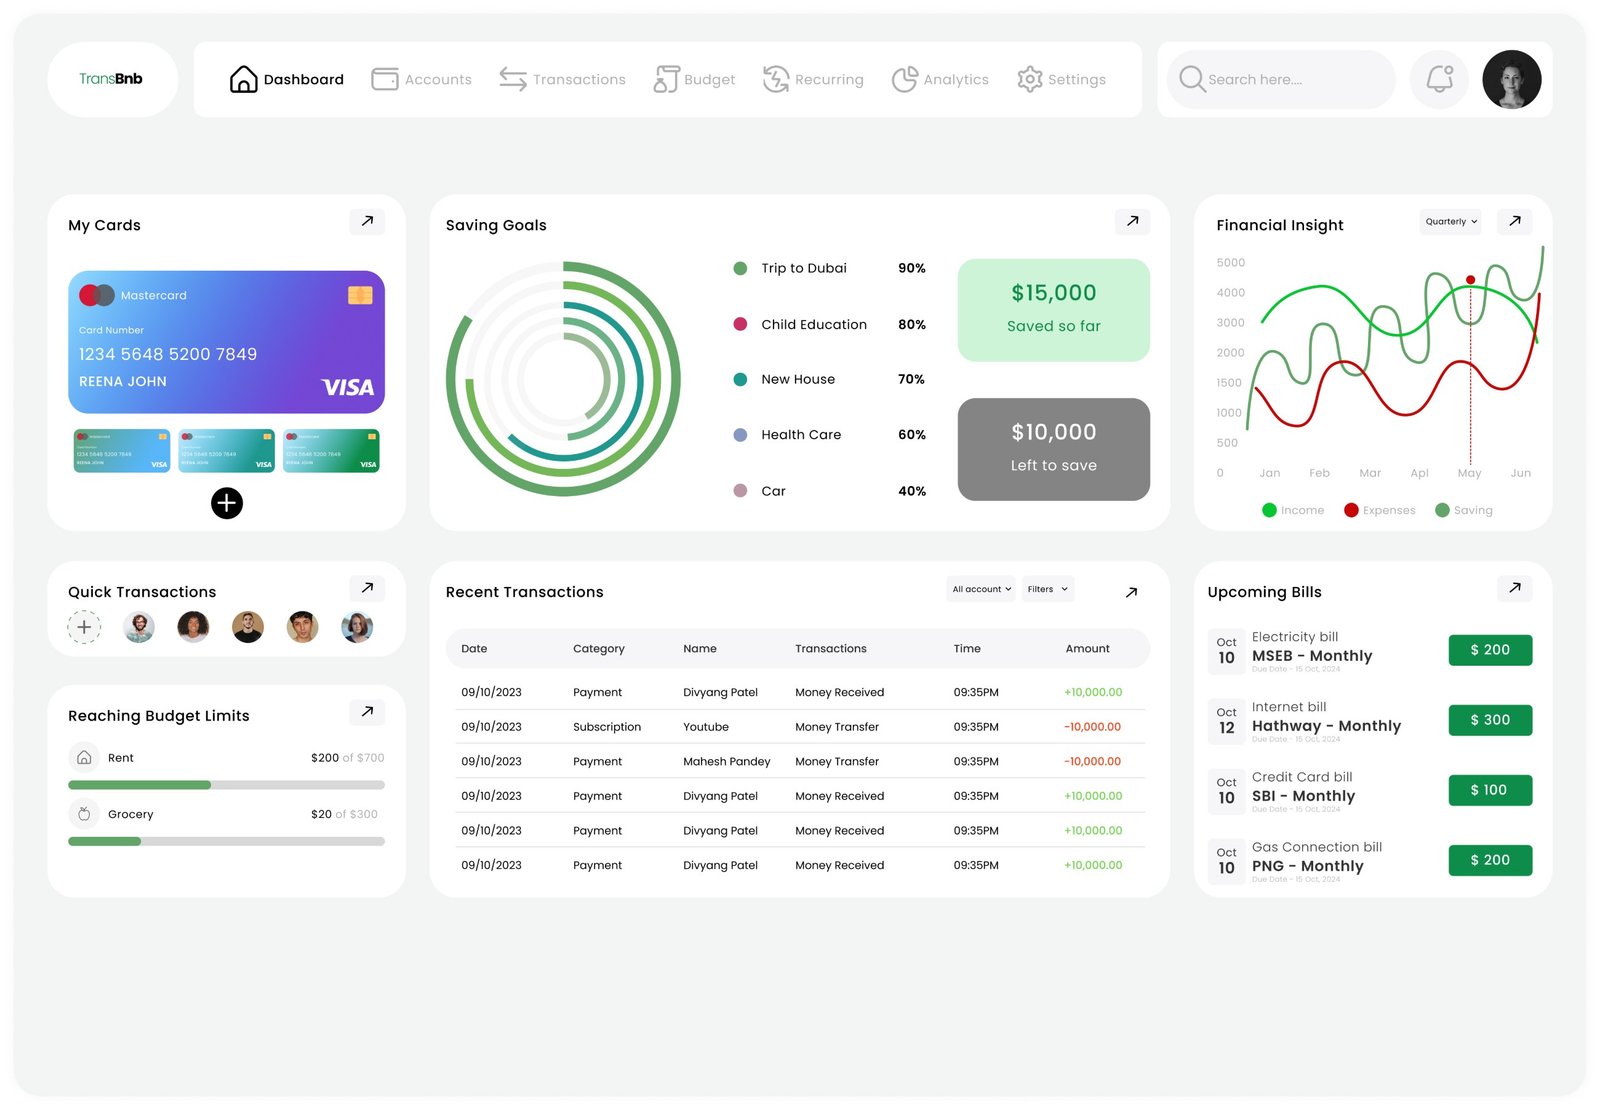
FinanceDashboard
A finance operations dashboard designed at Rezolve AI for TBX (formerly TransBnk) — corporate banking infrastructure for banks, enterprises, fintechs and NBFCs.
TBX runs the plumbing behind business banking.
Its platforms — TxBHub, TrustHub, APIHub and ReconX — handle treasury, payments, collections, escrow, mandates and reconciliation for banks and enterprises. Operations and finance teams needed one place to see it all.
Financial operations were spread across separate products and reports.
Payments, collections and reconciliation status lived in different views. Answering “where is our cash, and what is still unreconciled?” took manual work across tools.
Sat with the people who move the money.
- User interviewsFinance and operations teams
- Task analysisDaily and monthly checks
- Data auditSources, reports, spreadsheets
- Usability testingPrototype rounds
Key insight: users didn’t need more data — they needed the few numbers that tell them whether to act.
One dashboard for money in, money out, and what’s next.
Cards, saving goals, income-versus-expense insight, quick transfers, budget limits, recent transactions and upcoming bills sit on a single screen, with Accounts, Transactions, Budget, Recurring and Analytics one tap away. Every panel shares the same card, chart and table components, so the screen stays calm despite the density.
- My CardsAccounts
- Saving GoalsProgress rings
- Financial InsightIncome · Expenses · Saving
- Recent TransactionsFilterable table
- Upcoming BillsDue dates · Pay
- Reaching Budget LimitsAlerts
Four decisions that shaped the dashboard.
- 01Glanceable overview
Cards, savings and income-versus-expense insight on one screen. - 02Goal tracking
Progress rings show how close each saving goal is. - 03Alerts before they matter
Budget limits and upcoming bills surface before the due date. - 04Filterable transactions
One table, filtered by account and type, instead of separate reports.
How success is measured.
| Metric | How it’s measured | Goal |
|---|---|---|
| Time to check cash position | Median time from login to answer | Reduce |
| Late or missed bills | Bills paid after due date, per month | Reduce |
| Weekly active users | Unique users per week | Increase |
| Support requests | Data-related tickets per month | Reduce |
Return on design: less time assembling numbers means more time acting on them, and alerts surfaced in time prevent late fees.
One view of financial operations.
Teams see cash, payments and reconciliation status together, with exceptions surfaced instead of searched for.
Mobile app
Fintech · iOS conceptTotal balance
Transactions
Emergency fund